The problem
Palm tree areas skyrocketed in Morocco recently and with new technologies emerging in the Agritech sector, applications for this important and very demanding tree have seen the day.
Unlike other crops, tree monitoring is crucial in palm tree production as a single tree carries behind huge investments and large sums of annual charges before it can even produce dates.
Monitoring processes require an operative tree database containing at least these important attributes:
Tree id: trees are mostly identified by their plot reference, row number and tree position. Therefore, a tree belonging to the 3rd position of the second row in plot number 1 would be labeled as P1R2T3;
Plantation date: tree plantation date is by default equal to the plot’s date but might differ later on. Aggregating this info per plot would avoid us the pain of defining it for each tree;
Coordinates: mapping is crucial in farm information systems since satellite and drone imagery brought about drastic changes to daily decision making. This requires not only typical plot polygons but also single trees positions;
Plot: farms are typically divided into plots of a couple hectares or more and the tree – plot attachment is paramount to their structural hierarchies.
So…
How can we harness the power of AI, machine learning and design patterns to completely or partially help farmers monitor their plantations up to the tree level?
Exploratory research
Exploring possible solutions was a natural first step to look for existing methods to solve similar problems. Our research was centered around optimizing criteria such as cost, time and human intervention in the tree computing process.
The benchmark yielded the following results
Method 1: manual input
M1, short for method 1, required manually pinpointing each tree using a map tool and recording its latitude, longitude, row and position in an excel file.
We conducted an experiment to estimate the needed time to manually identify tree information for the average user. The experiment yielded 16 seconds per tree as a mean of 10 measures. In addition, the plantation density of palm trees is around 120-150 trees per ha and the spacing is around 9-10 meters. One hectare would therefore require approximately 34 minutes of manually jumping in and out of excel sheets and map tools.
The risk of human error, being quite high, also factored in the elimination of this first method.
Method 2: object recognition algorithms
M2 is a slightly more advanced method as it uses google map satellite views to try and pinpoint trees using basic object recognition.
This method is efficient for recognizing trees (even though noisy images are a pain), but doesn’t quite provide us with the needed infos we’re looking for namely trees ids and their coordinates. The latter can be inferred through extensive algorithms but will require manual input namely the starting line and tree.

To get rid of the noise, we’ll need more precise imagery. This is taken into consideration in the third method.
Method 3: Deep learning algorithms
M3 is a better version of M2 and is based on precise satellite imagery and computer vision to identify trees. This requires powerful tools solutions like ArcGis or python and precise satellite imagery such as OpenArialMap website. This method is thoroughly explained in this article from ArcGis:
https://learn.arcgis.com/fr/projects/use-deep-learning-to-assess-palm-tree-health/
However, precise satellite imagery is costly and rarely available for rural areas. Another alternative to satellite imagery would be the usage of drones. In fact, recognizing and labeling trees using images captured by drones would be quite simple as the images would be amazingly accurate.
Cost and accessibility-wise, this method is not the greatest. Let’s take a look at the 4th and final method.
Method 4: computing trees from plot polygon
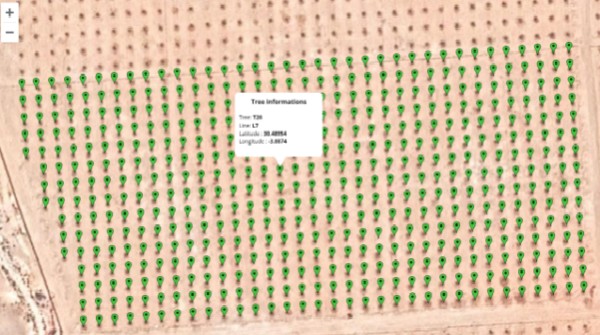
M4 uses the plot polygon to estimate tree positions and labels. We developed this method and integrated its api to Agridata’s BeeOne which makes the perfect framework to compute palm trees.
This method is a set of complex algorithms that transforms your plot’s polygon (plot edges) to a list of labeled and located trees with a user-friendly interface. The required inputs are:
Plot polygon: polygons are usually arrays of latitudes and longitudes stored in a Geojson format. A typical rectangular plot’s polygon would resemble something like this: [[latitude1,longitude1],[latitude2,longitude2],[latitude3,longitude3],[latitude4,longitude4]]
Tree and row spacing: spacing is crucial since it gives an important statistic which is the number of trees per line / plot. This statistic is used to verify / validate the tree’s position prediction.
Some rules for plotting:
– Get precise coordinates for edges: don’t just click on points erratically, try to get the closer possible to the real trees
– Start with your first line and first tree: this is how the algorithm recognize lines and tree positions
Using only these two inputs, you’re one api call from a map of computed trees:

Being simple, accessible and surprisingly efficient, the last method is a happy medium between cost, time and human intervention. Monitoring trees using devices, IoT or satellite imagery will now be a matter of seconds since all will be mapped, coded and stored within an open information system.
By Nabil Ayoub
Project manager at AGRIDATA Consulting
https://www.linkedin.com/in/nabil-ayoub/

